

Open the console
The engine has been running since Chapter 1. Start the console, a browser UI for inspecting it:http into link and
back:
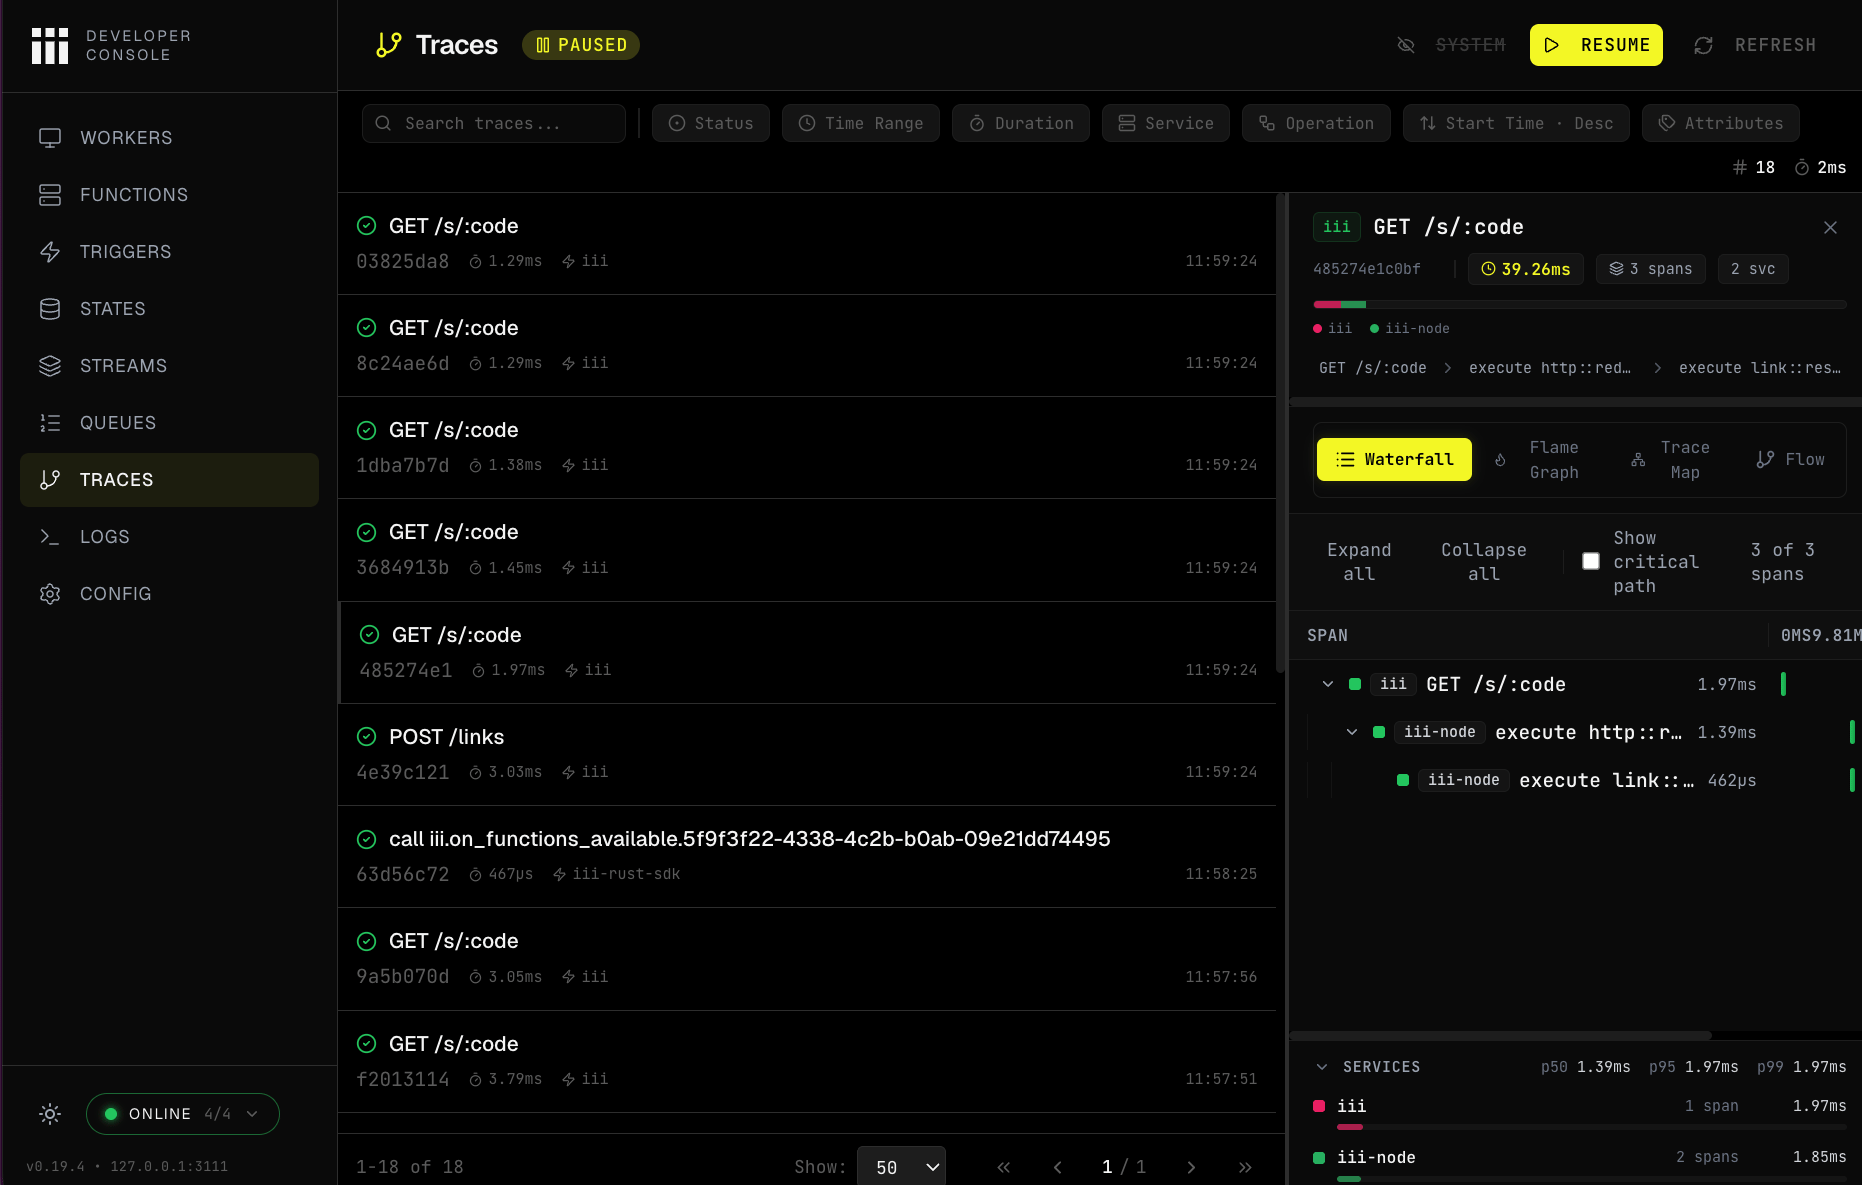
iii project init added the observability worker to config.yaml, and from then on every
request gets a trace and every Logger line is collected automatically, across workers. In iii
end-to-end observability is an inherent property of the system.
observability emits OpenTelemetry. Its traces, metrics, and logs are emitted as OTel, so
you aren’t locked into the console. You can point the worker at Honeycomb, Grafana, Datadog, or
any other OTel-compatible backend. See the worker’s configuration on
workers.iii.dev/workers/observability;
its settings are managed at runtime through the configuration worker.
The rest of this chapter is an optional deep dive on how to read the same logs and traces directly
from the engine. You can jump to Ch. 3: Persist everything if you
prefer.
Read the logs
Create some traffic:The
jq pipe filters the response down to the link resolved entries and keeps the parts that
matter for this tutorial, try removing it to see all the information the iii engine can provide.data is exactly what you passed to logger.info; the engine stores those fields as individual log
attributes, so the jq above gathers everything except the OTel metadata keys. The trace_id ties
the log to the trace it came from, which is where you look next.
Follow a redirect across workers
Everything that happens on a iii system has a trace. So the http requests have traces that cover the full execution context of the request. Grab the most recent redirect’strace_id and walk the whole
request as a tree. Capturing the id into a shell variable keeps this a single paste:
The
jq pipe walks the nested roots tree, indenting each span by depth and printing its
service_name and duration in milliseconds. You get the full path of one redirect, across two
workers:/s/:code via the http worker’s Trigger, calling
http::redirect in link, which then calls link::resolve in the link worker via the engine.
The per-span timing shows where the request spends its time.
Worker spans export on a short delay, so a brand-new request’s trace can be missing or look
truncated for a second or two. If you encounter this wait a few seconds and try again.
Compare traces to find the slowest links
To compare many traces it’s possible to filter, list, and sort them in one operation. Here are the redirect spans sorted by duration, slowest first:trace_id, slowest first:
trace_id with engine::traces::tree to see
which hop is responsible.
Conclusion
Linkly is now observable: the console shows every worker, trace, and log as it happens, and you can read the same data from the engine withiii trigger. The links are still kept only in memory,
though, so restarting the engine clears them. Next, in
Ch. 3: Persist everything, you move them into durable storage.